Warning
This post is more than 5 years old. It may not fully represent my current thoughts on this topic. Please keep that in mind while reading.
Your unit tests are broken, you need to figure out what happened. You analyze the stack trace and open up the file you feel to be guilty of the error. You put some var_dump statement - maybe you’ll put it in some pre in there and then just die().
It doesn’t help much, so you open up the next file and start again, maybe copy-paste your “debugger-statements”.
We have all been there, but please, don’t do it again!
I’m sure most PHP devs have some experience with real debuggers. Nowadays not only C and Java, but most JavaScript developers would instantly quite their jobs if they had no quality IDE/browser support for debugging. Even most PHP guys will have xDebug installed, because it adds a much nicer stack trace. Still, most of them will not worry about setting it up properly.
Don’t get me wrong, I’ve been there, done that. Even a few weeks ago, since I work in a somewhat new environment. (vm, phpStorm) Still, it really isn’t that big of a hassle to set up, even if your stack is a bit more complicated. Here are my settings for running php on a virtual machine and phpStorm on the host with port 9999 instead of the default 9000.
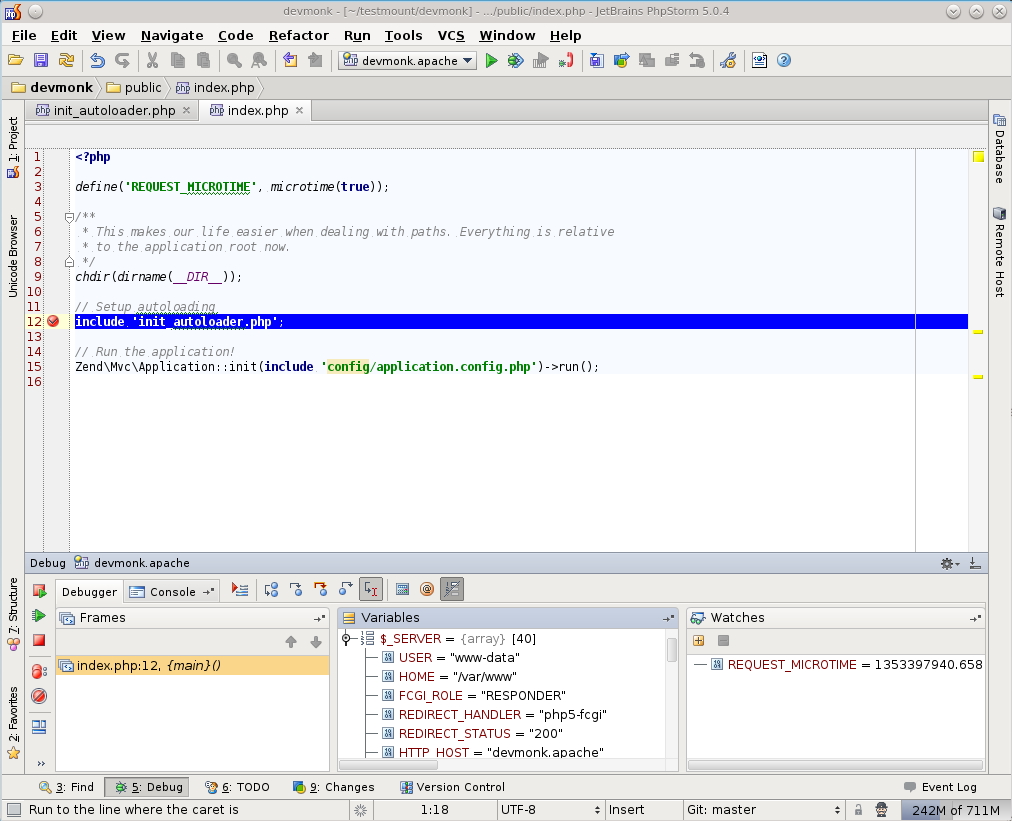
Here’s what you should end up with:
Here’s my Xdebug.ini:
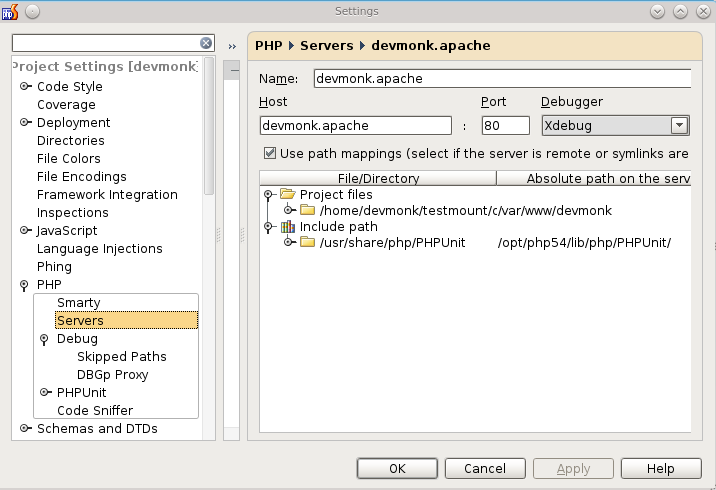
You should make sure you’re server is set up correctly.
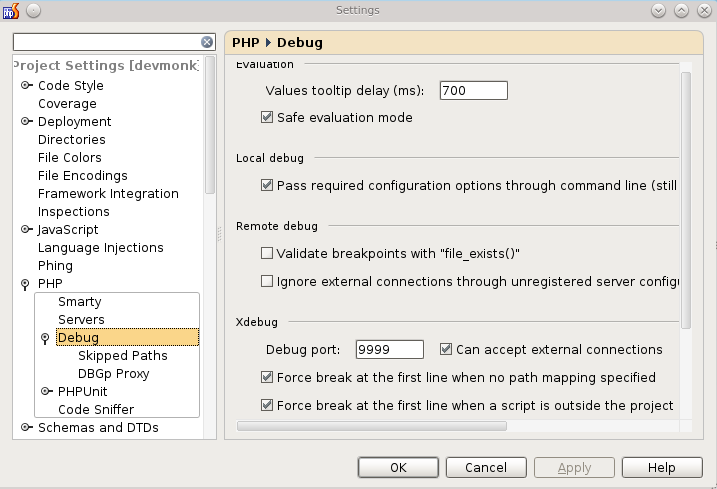
You only need to worry about the Xdebug port here, it defaults to 9000.
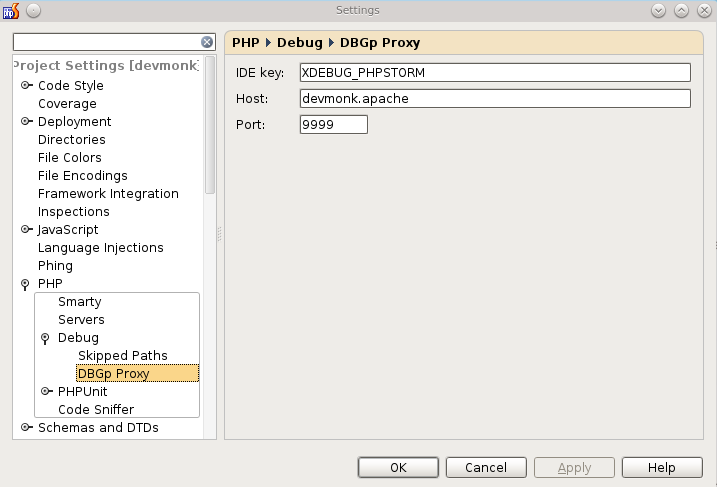
I think the IDE key is not important here, but it doesn’t hurt any, so just set it as suggested.
Finally, my run/debug options:
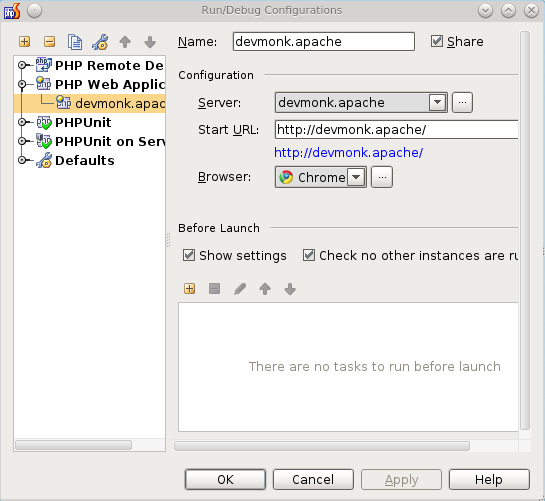
I might eventually write a longer piece with a few IDE options, but I think this should also give you an idea, how to set it up in your environment.
Happy debugging everyone!
